Nearly 15 million homeowners in 22 major U.S. cities are bracing for a financial shock in 2026. From Fort Lauderdale to San Francisco, home prices are expected to drop sharply, affecting retirement plans, mobility, and stability. Pandemic-era gains are reversing, leaving homeowners, construction workers, and insurers grappling with profound consequences. Here’s what’s going on.
What The Forecast Reveals

Realtor.com’s December 4, 2025 forecast predicts price declines in 22 of the 100 largest U.S. metros. Fort Lauderdale leads with a 10.2% drop, followed by North Port-Sarasota-Bradenton at 8.9%. Seven of Florida’s eight biggest cities are declining simultaneously, while 78 other metros see 4% gains, highlighting a split, uneven market.
The Hidden Crisis Underway

By November, nearly 900,000 homeowners were underwater, owing more than their homes’ value. This represents 1.6% of U.S. mortgage holders, per ICE Mortgage Monitor. Cape Coral shows 11% underwater mortgages, one-third from 2023-2024. Austin’s 7% underwater rate hints at precedent risks. Homeowners in these cities face maximum danger.
Equity Loss Calculations

With a $440,000 median home price, Fort Lauderdale homeowners could lose $44,880 in equity, while North Port faces $39,160 losses. Across 14.6 million homes in declining metros, total equity losses exceed $640 billion. Austin’s 22% peak decline equates to $130,000 lost per home, revealing the stark downside when markets turn sharply.
The Rate Relief Mirage

Mortgage rates may fall modestly: 6.6% in 2025 to 6.3% in 2026, per Realtor.com. Fannie Mae projects 5.9% by year-end 2026. Yet rate relief cannot counter the affordability crisis driven by elevated prices relative to income. First-time buyers, only 21% of the market, remain priced out despite lower rates.
The Insurance Catastrophe

Fort Lauderdale residents pay $16,700 annually for insurance, Miami $15,500+, far above national averages. A $440,000 home’s $1,391 monthly insurance costs outweigh the mortgage. Dozens of insurers left Florida since 2017, leaving Citizens Property Insurance with 1.3 million policies. Systemic risk is high: one hurricane could strain the insurer dramatically.
The Pandemic Boom Reversal Quote

Jake Krimmel, Senior Economist at Realtor.com, stated: “These places, among others, saw a huge frenzy during the pandemic, so part of what we are projecting is that demand continuing to come back down to earth.” Remote work normalization and affordability limits are reversing demand in Sun Belt cities.
The Delisting Surge

September 2025 saw for-sale listings removed 52% more than September 2024, per Realtor.com. Sellers withdrawing homes avoid losses, yet underwater mortgages spread as Neil Dutta explained: “No one wants to sell if they are in negative equity.” Delistings constrain transactions while reducing the market’s ability to clear, signaling early distress.
Price Cuts Accelerating

In 2025, 60% of sold homes had price reductions, while 25% of Florida listings were cut, ranking the state second nationally. These discounts confirm the 2026 forecast is already reflected in behavior. Sellers accept lower prices in real-time, showing markets adjusting before predicted drops. Yet real families are facing tough choices now.
The At-Risk Cohorts

FHA and VA borrowers hold 66% of underwater mortgages, often first-time buyers or military members. FHA loans have 10.6% delinquency rates, highest among all loan types. Recent buyers from 2022-2025 bought at pandemic peaks; 27% of 2023-2024 Cape Coral loans are underwater. Aging first-time buyers face equity loss and limited future purchasing power.
Real Estate Agents Losing Ground

Redfin’s August 2025 survey shows 43% of agents report commission declines, with high-end homes dropping 13 basis points to 2.11%. Median homes see $2,870 loss per transaction. NAR’s 1.5 million members face earnings pressure, while 72% report no change. Market bifurcation creates inequality in income. Agent challenges are severe but pale versus construction losses.
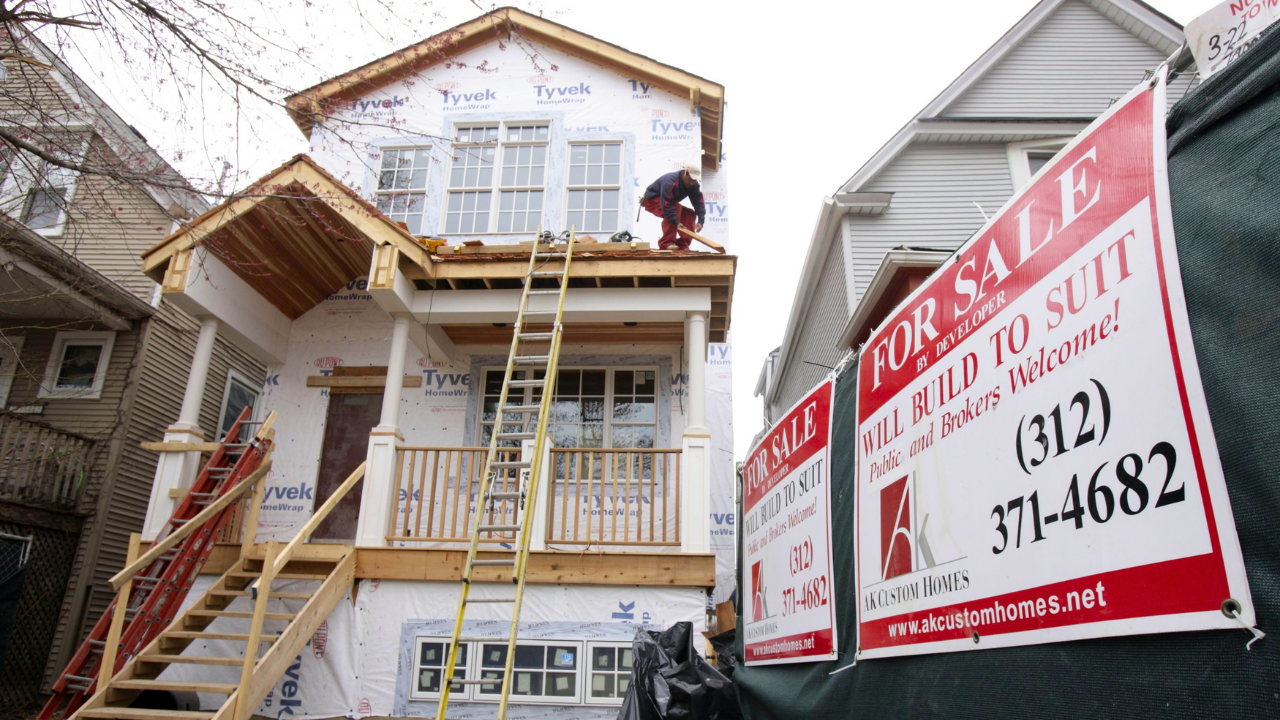
Construction Employment Collapsing

Residential construction jobs fell three consecutive months through October 2025, per MetLife/NHCA. Eleven million workers face risk. Specialty trades like electricians, plumbers, and HVAC technicians are hit hardest. Hispanic-owned firms reliant on residential projects face thin margins. NHCA warns the housing slowdown begins in construction, rippling across supply chains and affecting related employment in weeks.
Supply Chain Stress

Material prices are up 5% year-over-year with 25-30% tariffs on steel, aluminum, and lumber, hitting a 40-year high. Reduced construction demand leads to inventory buildup and margin pressure. Deloitte warns tariffs may rise in 2026 amid trade uncertainty, trapping suppliers between rising costs and shrinking opportunity, compounding economic stress on household finances and retirement plans.
The Retirement Security Threat

Home equity is Americans’ largest wealth component. $44,880 to $130,000 losses per home threaten retirement readiness. Median 40-year-old first-time buyers have only 25 years until retirement, leaving permanent wealth destruction. Millions face reduced spending, tax revenue losses, and potential recession risk if employment falters. Retirement security depends heavily on whether equity losses deepen or stabilize.
Delinquency Rates Hitting Pandemic Highs

30-day delinquencies reached 3.68% in Q2 2025, highest since pandemic recovery, per Construction Coverage. FHA loans lead at 10.6% delinquency. Andy Walden, ICE head of mortgage research, warned on November 12: underwater homeowners “are more likely to be in the Sun Belt.” Rising delinquencies heighten foreclosure risk and potential market contagion, threatening broader economic stability.
The Foreclosure Contagion Scenario

Underwater homeowners losing jobs have minimal equity, increasing default likelihood. Foreclosures sell at 20-30% discounts, lowering neighborhood values and triggering a negative feedback loop. Richard Moody, Chief Economist, Regions Financial, stated on November 12: “While aggregate equity positions remain stronger than decades, the underwater phenomenon poses risk if homeowners run into financial hurdles.”
Geographic Split: Why Some Markets Rise While Others Fall

78 of the 100 largest metros are rising 4% on median. Sun Belt metros are declining, Northeast and Midwest metros gaining. Pandemic-era migration reversed toward traditional job centers due to affordability and insurance crises. Split markets complicate policy response, highlighting that one-size-fits-all solutions cannot stabilize a regionally divergent housing landscape and economic trajectory.
The Real Estate Market’s Two Americas

National median price is $440,000, up 1.3%, masking divergence. Fort Lauderdale drops -10.2%, North Port -8.9%, while some metros rise 5-8%. Buyers in rising markets gain wealth; Sun Belt buyers lose equity. Mortgage servicers face regional concentration risks. The national market is fragmented, with opposing submarkets shaping distinct economic realities and policy challenges.
The Mirror Image of 2020-2022

Pandemic boom cities like Fort Lauderdale, North Port, Phoenix, Boise, and Raleigh face the steepest declines, reversing explosive population inflows and construction. Traditional Northeast and Midwest metros rise. Migration reversal—not affordability improvement—drives the pattern. Pandemic-era wealth creation is now wealth destruction in Sun Belt cities. The cycle completes, setting the stage for broader 2026 impacts.
What 2026 Means For You

For 14.6 million homeowners, 2026 is a financial reckoning. Recent buyers face $39,000-$44,000 losses. Underwater homeowners cannot sell or refinance. Construction workers face reduced hours, agents lose commissions, and small businesses feel pressure. Defaults could trigger foreclosure surges. Stronger lending standards and healthier equity positions may limit broader collapse—but Sun Belt corrections could ripple nationally.
SOURCES
Realtor.com 2026 Housing Forecast, December 2025
Intercontinental Exchange (ICE) Mortgage Monitor, November 2025
MarketWatch Housing Market Analysis, November 2025
Redfin Real Estate Survey Data, August-October 2025
MetLife Investment Management Construction Analysis, October 2025
Deloitte 2026 Engineering and Construction Outlook, November 2025
HH Insurance Group Florida Insurance Crisis Analysis, October 2025
Climate and Community Institute Housing Insurance Research, 2024-2025