
America’s job market hides stark divides. According to August 2025 Bureau of Labor Statistics data, the top 10 states with the highest unemployment rates range from 5.5% to 4.6%.
These hotspots cluster in coastal giants, Rust Belt holdouts, and remote outposts—affecting an estimated 3.5–4 million workers amid an uneven recovery. What drives this disparity?
1. California

California tops the list with 5.5% unemployment in August 2025—the nation’s highest rate. Home to nearly 40 million people (roughly one-ninth of the U.S. population), the state grapples with a rare population decline tied to soaring housing costs and out-migration. Structural woes persist in this economic powerhouse, despite its global tech dominance.
2. Nevada
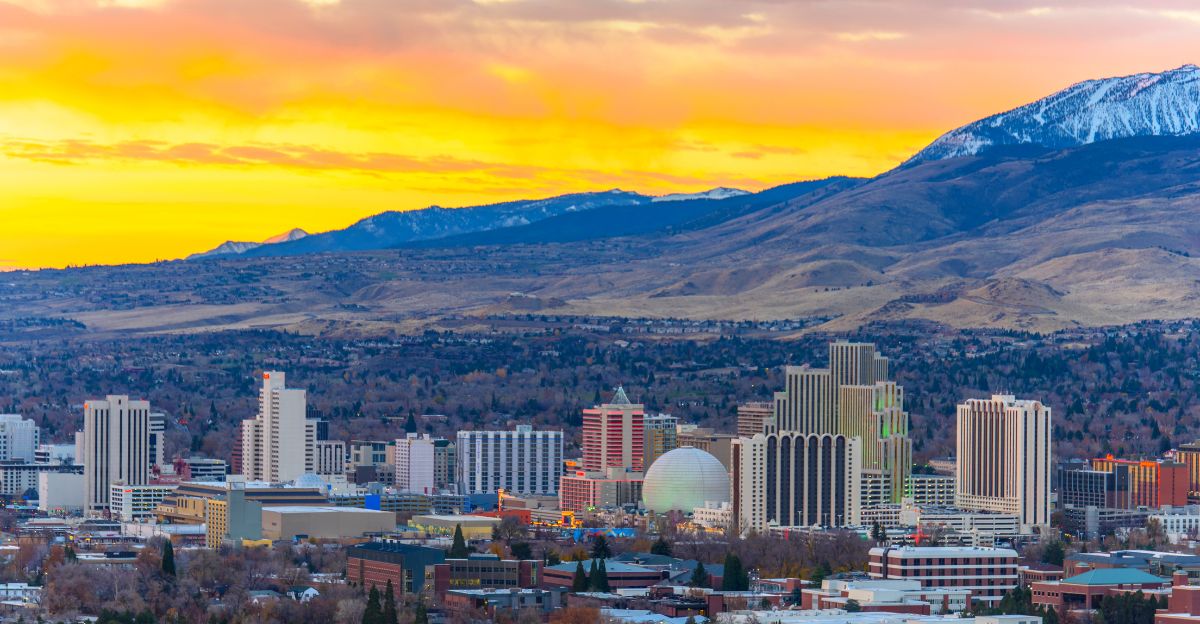
Nevada has a rate of 5.3%, the second-highest in the country, driven by its heavy reliance on casinos and tourism. Nearly three-quarters of residents live in Clark County (Las Vegas), where economic swings hit hard.
Visitor dollars dictate fortunes, and joblessness lingers as recovery stutters. Vulnerable sectors mean bigger risks ahead for workers.
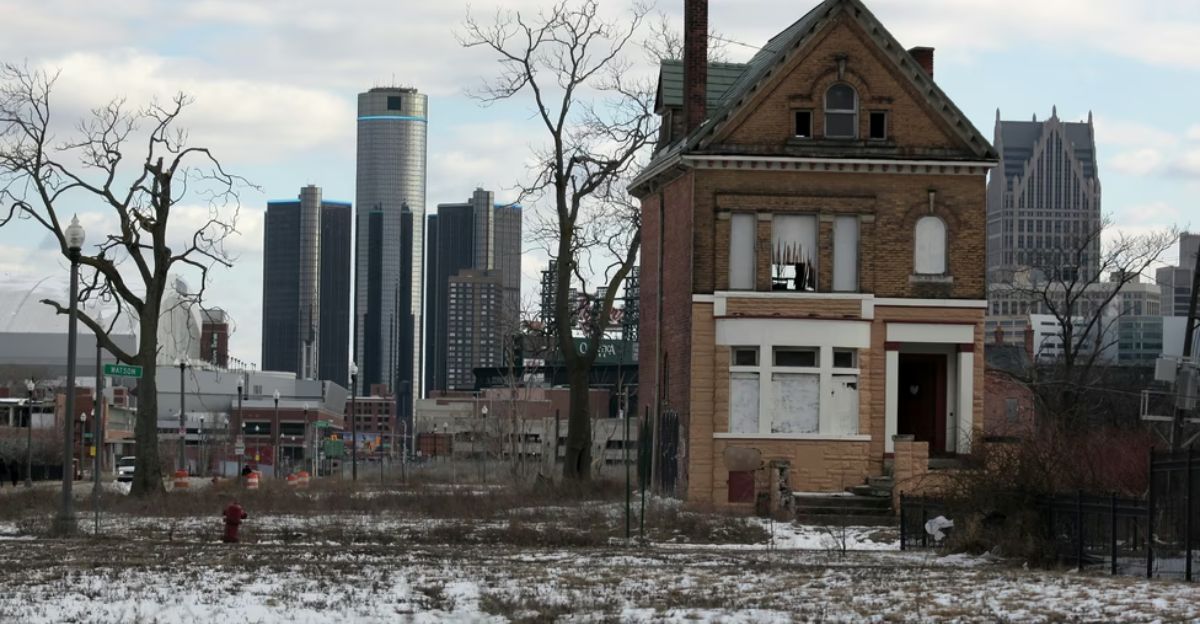
3. Michigan
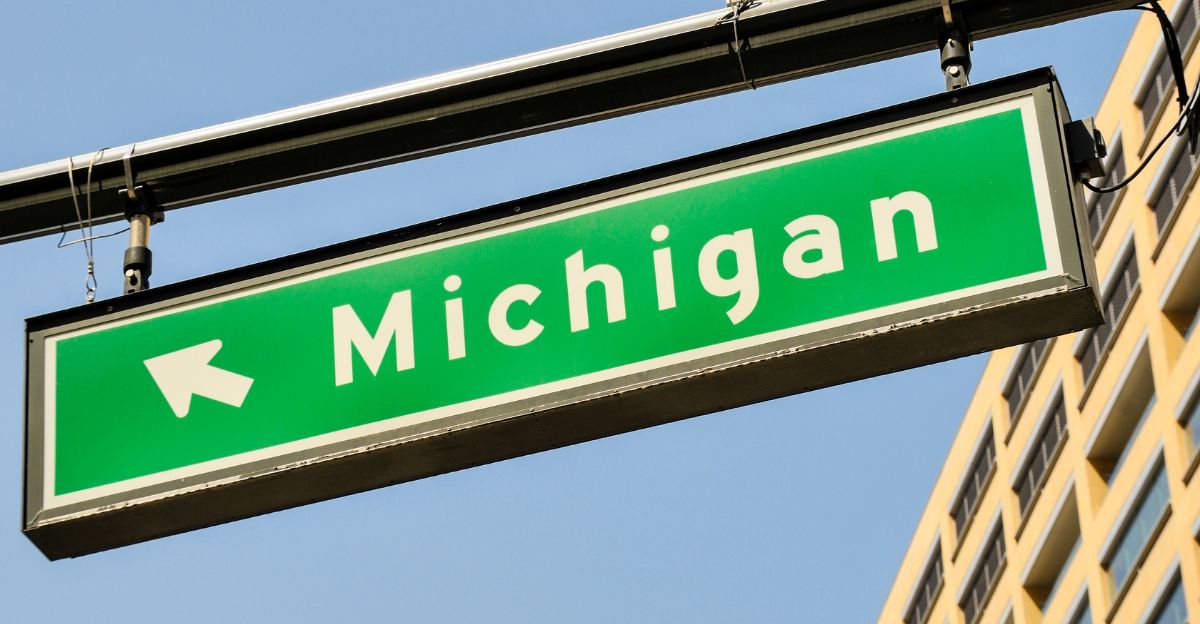
Michigan’s 5.2% rate ranks third, a legacy of decades of deindustrialization. The state lost over 300,000 manufacturing jobs during industrial decline, hollowing out the Rust Belt core.
While the auto industry still supports hundreds of thousands of jobs, historical losses echo through communities. Can factories ever fully rebound?
4. New Jersey

New Jersey ties for fourth at 5.0%, a Northeast contender with 9.5 million residents. Dense population and commuter ties to NYC amplify pressures, while roughly one-quarter of the population is foreign-born.
Jobs stall amid regional shifts as historical resilience meets modern economic hurdles. What overlooked factors tip the scale?
5. Ohio
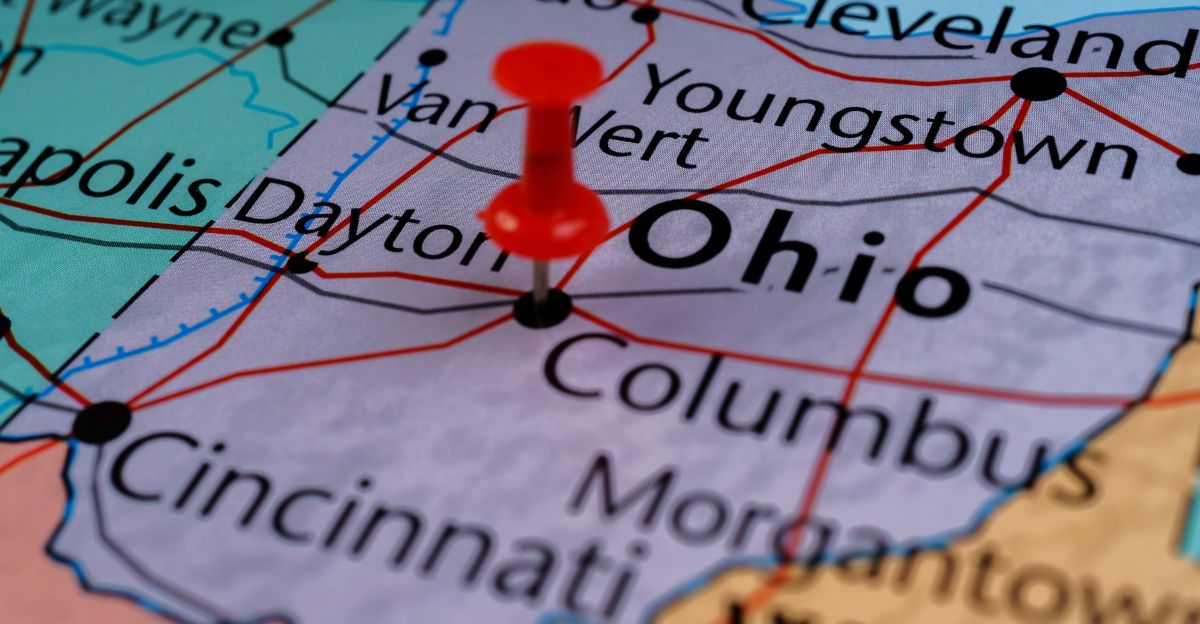
Ohio also reaches 5.0%, bearing deep manufacturing scars—over 300,000 jobs vanished during the deindustrialization era. Unemployment peaked above 11% during the 2009 Great Recession.
Former steel powerhouses like Cleveland and Youngstown still face recovery challenges decades later. The legacy of that collapse persists throughout this Midwest pivot point.
6. Oregon
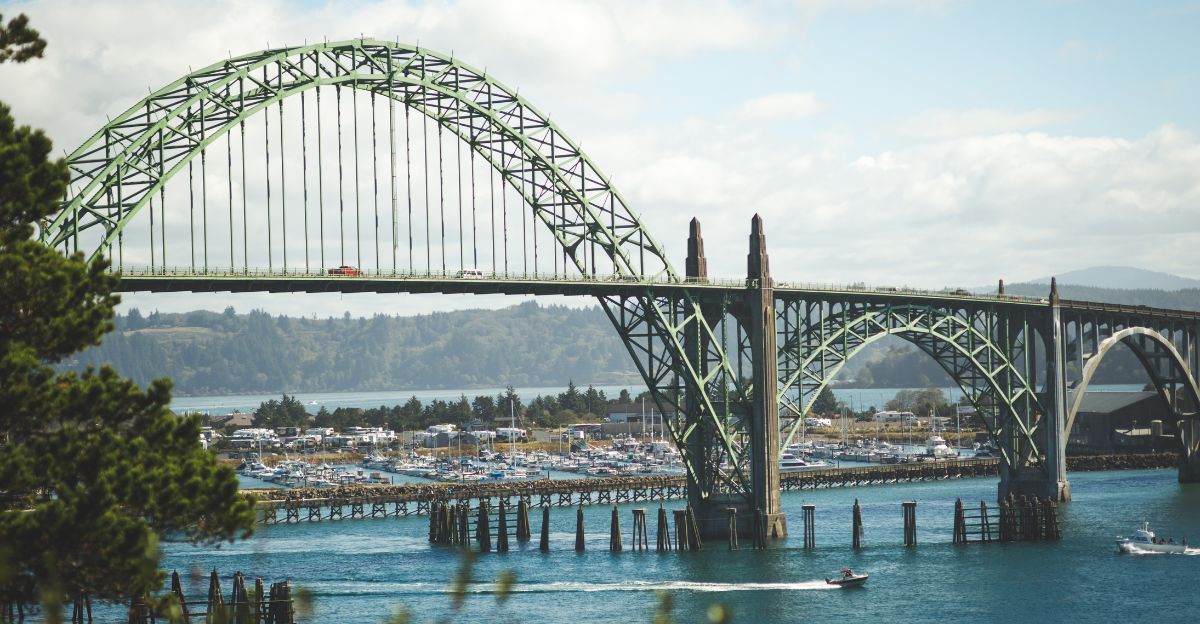
Oregon matches 5.0%. Despite being the nation’s top lumber producer, the state faces decades of declining federal harvests and rural mill closures.
Even with Intel anchoring the “Silicon Forest” and Nike’s headquarters, sector volatility raises long-term alarms for workers. Rural economies struggle despite the presence of tech giants in the state.
7. Massachusetts
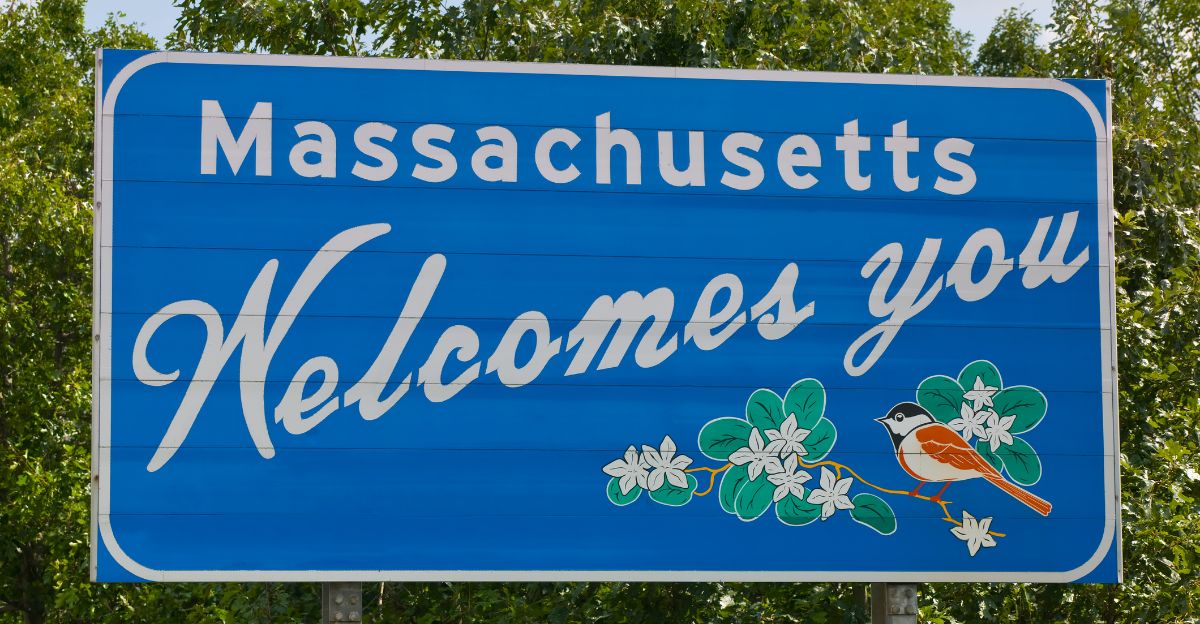
Massachusetts clocks in at 4.8%, a surprising crisis in a tech-dominant state. While the Route 128 corridor drives innovation and high incomes, a sharp divide exists between Eastern prosperity and Western decline.
Innovation hubs coexist with significant job gaps, challenging the “Bay State” image. Does education alone guarantee employment?
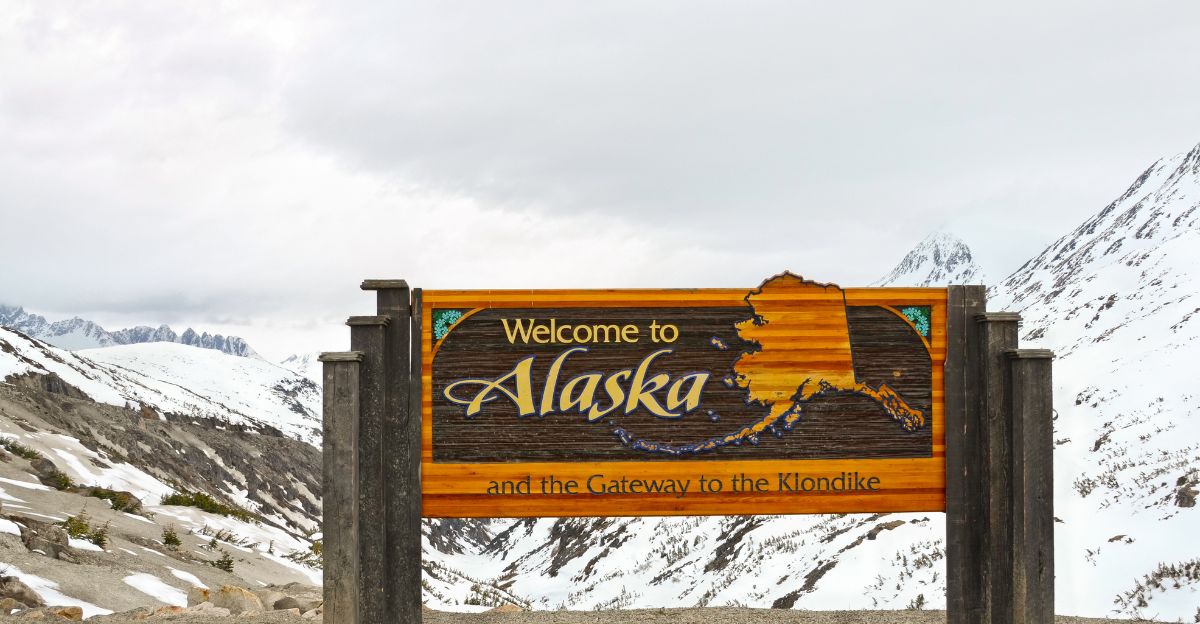
8. Alaska
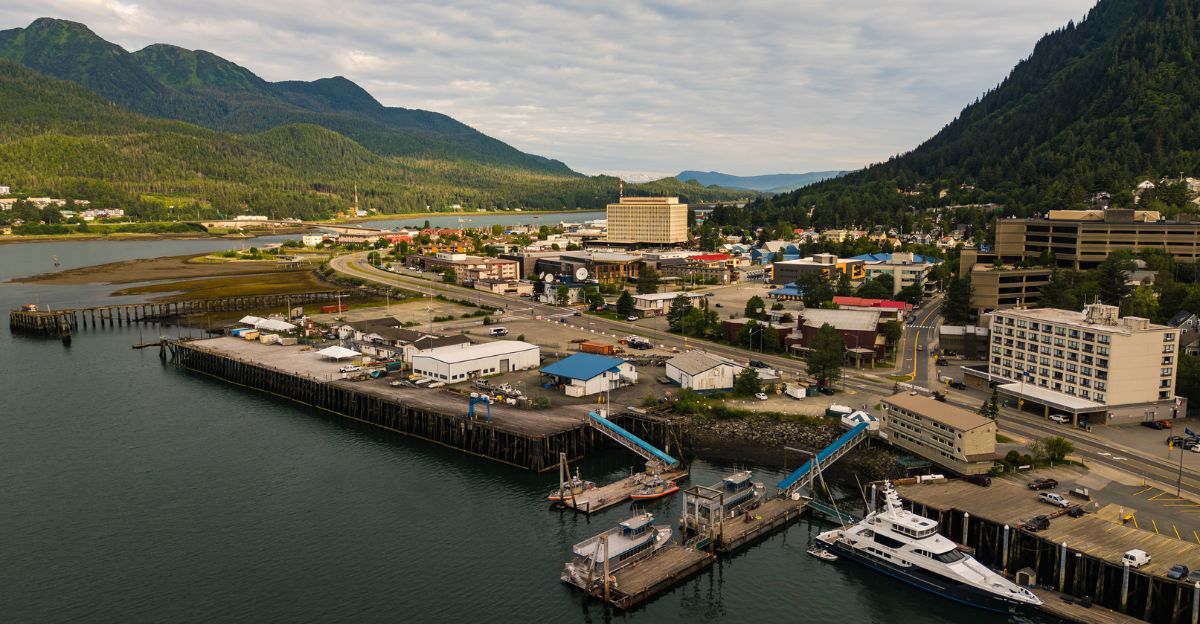
Alaska ties at 4.7%. Its 740,000 residents are spread over vast lands larger than Texas, California, and Montana combined.
The economy relies heavily on oil, fishing, and federal government spending, but fluctuations in these resources can hit isolated communities particularly hard. Geography amplifies the toll of unemployment in America’s “Last Frontier.”
9. Kentucky
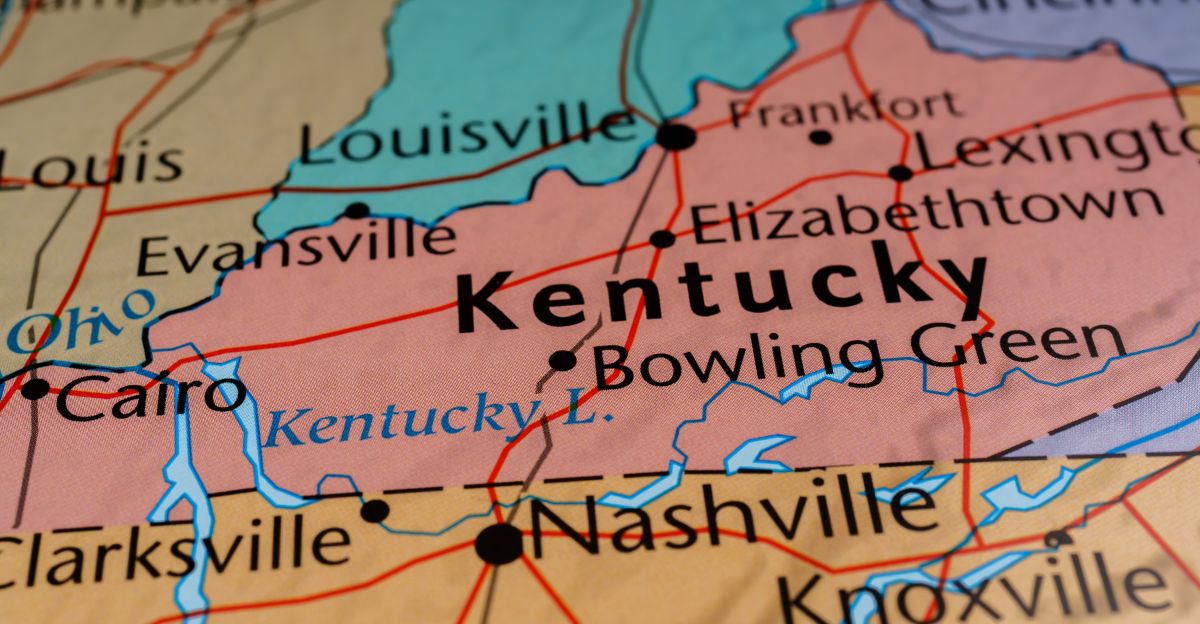
Kentucky also reaches 4.7%, tied for ninth. While urban centers like Louisville and Lexington grow, rural counties—especially those in the east—face population loss following declines in coal and manufacturing.
Steady joblessness underscores rural struggles across Appalachia and beyond. Renewal feels distant in the hardest-hit communities.
10. Rhode Island

Rhode Island rounds out the list at 4.6%. The nation’s smallest state was the first to deindustrialize, with aging mill towns now transitioning to service sectors.
The “Ocean State’s” compact economy falters amid national trends, showing that small size doesn’t prevent outsized unemployment challenges.
Rust Belt Echoes

Top ranks revisit Michigan and Ohio’s pain—each state has lost over 300,000 manufacturing jobs over decades of industrial shifts. Deindustrialization’s shadow fuels rates of 5% or higher.
Families feel generational hits as history warns of stalled comebacks. Recovery efforts across the Midwest continue to fall short of the levels of prosperity seen in the past.
Tourism Traps

Nevada’s casino dependence spotlights tourism risks, mirroring seasonal slumps elsewhere. With three-quarters of the population concentrated in one county, an economic slowdown has a wide ripple effect.
Vulnerable economies invite debate on diversification as recovery remains fragile. Las Vegas tourism hasn’t translated to stable employment for all workers across the state.
Housing Headwinds
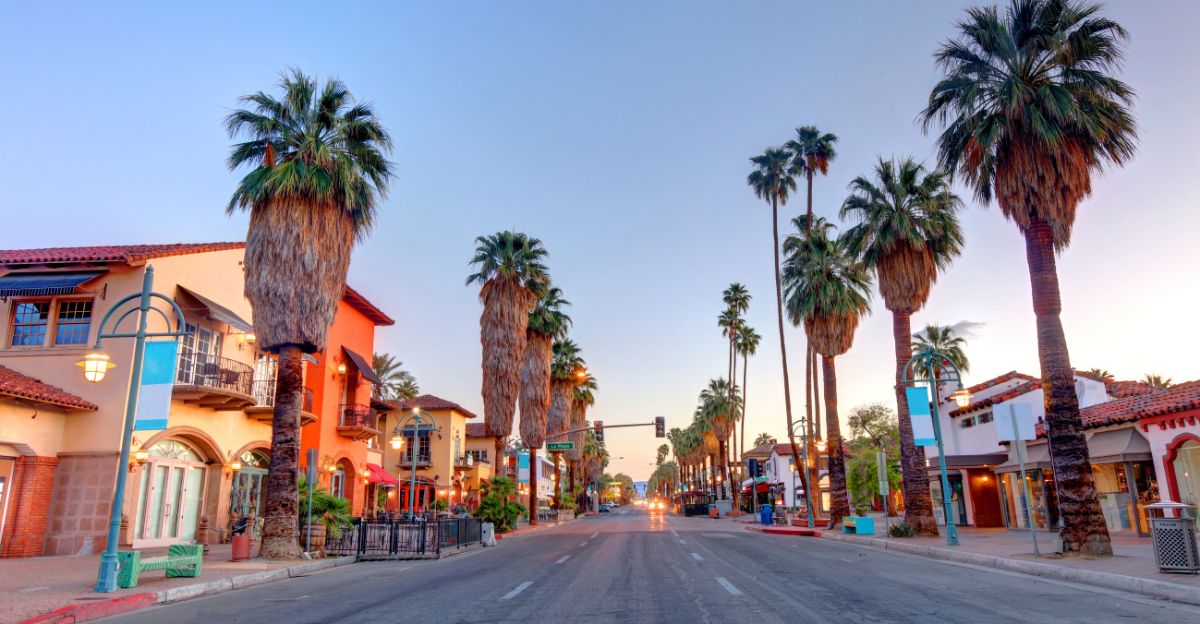
California’s crisis ties directly to soaring costs and population outflows, burdening its nearly 40 million residents. A 5.5% unemployment rate—highest in the nation—coincides with rare population decline.
As population shifts worsen job mismatches, national lessons about housing and employment emerge from the state’s ongoing struggles and challenges.
Remote Realities
Alaska’s expanse—larger than three massive states combined—strains its 740,000 residents at a 4.7% unemployment rate.
Distance hikes cost for the unemployed; isolation’s price demands attention in a state heavily reliant on resource extraction.
Geographic barriers compound job-seeking challenges for isolated communities throughout the state’s interior and remote regions.
Ties That Bind

Three states deadlock at 5.0%: New Jersey, Ohio, and Oregon. These ties spark “what if” debates on rankings and regional comparisons.
Equal pain stems from varied causes—shifts in port traffic, manufacturing scars, and timber volatility.
Consensus eludes as each state fights unique employment headwinds and economic pressures. Understanding these differences is crucial for developing targeted policy solutions.
Lumber Legacy

Oregon leads U.S. lumber output, yet unemployment remains at 5.0% despite the forestry sector’s dominance. Forestry can’t buffer workers against mill closures and federal harvest restrictions.
Rural jobs are vulnerable to fluctuations in global demand and market volatility. Oregon’s economic concentration reveals hidden vulnerabilities in wood-dependent communities across the state’s rural regions and isolated timber towns.
National Drag

The elevated rates in these 10 states impact millions, hindering national growth and economic momentum.
An estimated 3.5–4 million workers face joblessness across these high-unemployment regions. Regional gaps signal inequality; uneven recovery heightens policy stakes for federal action.
Momentum builds toward systemic fixes addressing the root causes of regional unemployment disparities.
Low-End Contrast
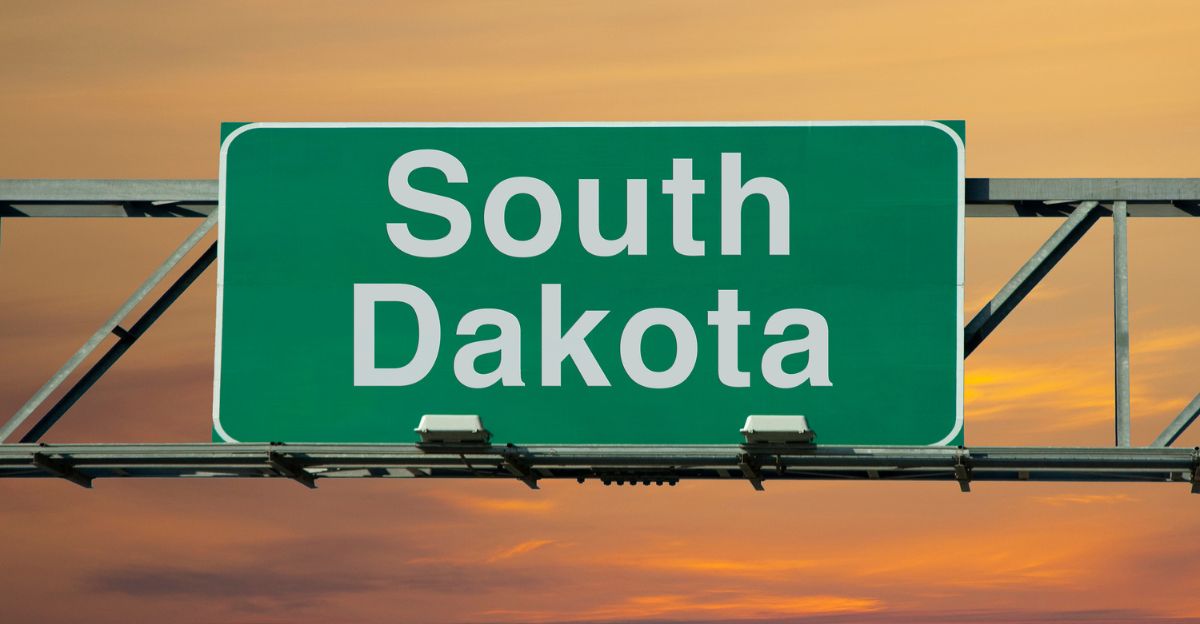
Contrast South Dakota’s 1.9% and North Dakota and Vermont’s 2.5% against the top 10’s crisis rates. A massive 3.6 percentage point spread separates the best from the worst unemployment nationally.
Why do Great Plains states thrive while coastal and industrial giants sink? Geographic and economic factors create vastly different job market outcomes across regions.
Warning Unheeded?
The Top 10’s cluster, from coasts to the Rust Belt, signals deep disparities affecting millions of American workers. BLS data highlights the need for action on housing, industry losses, and rural isolation.
The journey reveals jobs aren’t equal everywhere, and recovery isn’t universal. Policy responses must address structural causes. Change or stagnate? The answer shapes America’s future.
Sources:
U.S. Bureau of Labor Statistics, August 2025 Regional and State Employment Report
U.S. Census Bureau, Population and Demographic Data 2023–2025
BLS Historical Labor Force and Manufacturing Employment Data
Federal Reserve Bank Regional Economic Analysis Reports
USDA Forest Service, National Lumber Production and Harvest Data
U.S. Geological Survey, Geographic and Demographic Reference Data